The joint Environmental Toxicology & Chemistry Laboratory (ETCL) at Savannah State University (Savannah, Georgia, US) is collaborating with others to track suspended particulate, sediment, and fauna-associated microplastic distributions in Georgia’s aquatic environments, employing paired water and sediment sampling to enhance data collection.
Coastal Georgia, US estuaries are at risk for microplastic accumulation due to human population density. The connection to the large intra-coastal waterway system and adjacent sounds within the region points to the waters within Gray’s Reef National Marine Sanctuary (GRNMS) being potentially influenced.¹ Therefore, it is necessary to understand microplastic abundance in the lower estuaries and sounds and GRNMS.
All sounds along the Georgia coast may be influencing the concentration of plastics within GRNMS. In past studies in the region, water from the Altamaha River to GRNMS flowed southeast at ~1 km/h, which indicated that waters in the Altamaha Sound are influencing waters within GRNMS¹. Additionally, coastal Georgia waters are relatively understudied areas for microplastic abundance. There have been three publications 2,3,4 and a thesis⁵ to date that reported microplastic abundance within the Coastal Georgia region. Thus, the goal of this project is to address the aforementioned gaps in understanding microplastic abundance, reservoirs, and fate within and from the primary Coastal Georgia river systems (Savannah, Ogeechee, Altamaha, and Satilla) out to GRNMS.
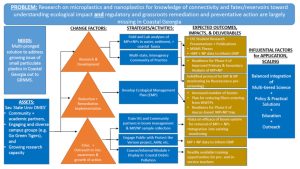
Key elements of these improvements can be seen in the Theory of Change schematic outlined below (Fig. 1).
Water, sediment, and faunal sampling
Following our established protocol⁵, water samples are taken within the shelf and coastal Georgia waters and GRNMS with a focus on sampling the coastal Georgia estuary systems and transects to GRNMS. ETCL is partnering with the National Oceanic & Atmospheric Administration’s (NOAA’s) GRNMS to access platforms of opportunity to sample the water and sediments and measure bathymetry and water flows. Depending on location, a manta net with a mesh size of 300 µm⁶ or whole water samples are taken using metal buckets for microplastic analysis.4,5 The net is towed outside of propwash for three minutes at an average speed of 1.2 knots.⁵ A calibrated flowmeter is attached to the mouth of the net, and its readings are used in calculating the amount of water sampled. In shallow-water systems, the same procedure is followed but using a smaller net. Samples are transferred to glass jars in the field. If metal buckets are used for water collection, the bucket contents are poured over a series of covered sieves, and deionised water is used to transfer sieve contents into a glass and metal muffled vial for storage until processing occurs.⁴ At a minimum, salinity and temperature are measured at each site.
Paired with water sampling, sediments are taken at the same locations. As of 2022, <20 studies have reported utilising a paired sampling approach, with the first report in 2018.⁷ This experimental design was developed to provide insight into the spatial abundance of microplastics in coastal Georgia waters and GRNMS (water data) and temporal microplastic abundance (sediment data). Focused paired sampling is needed to further understand the patchy distribution of microplastics and the variability between each sample, as seen in Geiger.5
As in previous collections, a Ponar grab or similar is used to collect surface sediment samples,⁵ at all sites except GRNMS or for SWEEP-K/kayak-based sampling (described below). Sediment samples are taken after surface water sampling, and every effort is made to reduce the disturbance of surface sediments.
Surface sediments from GRNMS are being collected via GRNMS-contracted divers or GRNMS Staff in the same manner as previously permitted by NOAA for Geiger and Ebanks in the Marine Protected Area (GRNMS-2021-001). Sediments are scooped into a glass jar and refrigerated at 4-6°C, if possible, or at room temperature in the laboratory until sample processing occurs.
Exposed sediments from human-powered vessels such as SWEEP-K are collected using a surface scooping approach comparable to that described above for GRNMS collections, and only the top 2-3 cm are retained. The depth of sediment samples, especially because they are homogenised, results in combining various temporal deposition events, and every effort is made to take this into account because incorporation of deeper sediments can result in underestimation of microplastic abundance, if sediments from periods prior to the manufacturing of plastics are included.
Sediments can serve as a long-term sink for microplastics,⁸ thus, determining the sediment deposition rate in the dynamic Georgia Bight environment is helpful to assess the amount of plastic that settles into the sediments.
Further, any estimations of the time of deposition will assist in framing the discussion of the time of settlement of microplastics in the target environments. Sediment traps or similar will be deployed at the sampling sites to determine the settling rates of sediment in situ.
Organisms are collected using a 5-minute trawl, cast net, or similar in coastal Georgia waters.⁹ Organisms are sorted and identified in the field. As a standard procedure, when >10 individuals are collected for the target species, ten are retained for microplastic analysis.
Amongst the organisms being studied in student-led projects are chironomids,10 oysters, palaemonid shrimps, penaeid shrimps, and gelatinous zooplankton. The goal is to study organisms commonly found across the study areas in surface water, mid-water, and benthic areas, including those exhibiting sessile and mobile life stages. Samples are stored on ice and frozen upon arrival at the ETCL until sample processing occurs.
Studying the shallows
Several tiers of motorised vessels are being used in this microplastic research. However, to access the shallowest of waters and intertidal zones where some oysters and other target habitats are located close to human developments, the team has been developing and testing human-powered crafts as platforms for studying locations that are closest to land-based anthropogenic inputs for small particulate plastics. Measurements and sample collections are often challenging in shallow waters, especially tidally influenced systems.
The Shallow-Water Estuary Exploration and Profiling by Kayak (SWEEP-K) platform is being designed, developed, tested, and utilised within this project as a vessel with a variable suite of sensors that are mountable on a human-powered craft to allow for efficient exploration and profiling of an estuary system while gathering georeferenced water chemistry and nutrient data. The four major components of the system are a human-powered craft, a support crate for the sensor package, a marine sensor package, geolocation, visual cataloguing, and a weather-sensing system.
The system will include a weather-tight marine 12v DC electrical system, including a 20 amp-hour Lithium-ion deep cycle battery, multiple 12v marine outlets, a data logger (as required by the instrumentation), and provision for a 55-watt solar panel and solar electric charger. A modular mounting and rigging system will facilitate sampling points for the marine sensors to be approximately 30.5 cm below the waterline and with a 30.5 cm lateral separation from the beam of the human-powered craft. The primary sensors that have been selected are for temperature, pH, salinity, turbidity, optical dissolved oxygen, chlorophyll, and optical nitrate to include a suite of water quality parameters that are complimentary to those measured in deeper waters. The marine sensor package may be customised, as required, to facilitate profiling of an estuary for a specific characteristic, with sampling and other sensor-based measurements deployable via an outrigger kit system.
Water tracking
Utilising Maker Buoy®, SonTek® Castaway conductivity-temperature-depth (CTD), and acoustic Doppler coupled profiling (ADCP) technology, the Hintz lab is leading the charge to determine water flows. Because the water flows in the coastal areas associated with this project are variably impacted by tides,11 precipitation runoff,12 and winds,13 this team is utilising repeated coordinated tracking of water movement in shallow-water and lower estuarine areas as well as tracking within and near GRNMS and moored devices in the targeted waterways for Eulerian measurements of temperature, salinity, pressure, and other parameters, as needed.
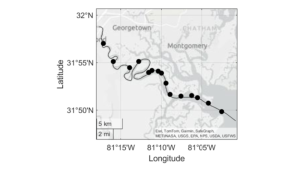
Within 2024, observations and sampling have been predominantly in the Wassaw and Ossabaw sound estuaries, with a particular focus on water tracking in the Ossabaw Sound-Ogeechee River System (Fig. 3).
Remote monitoring of the lower Ogeechee River bottom salinity was done to test systems and gauge the interaction between tides, river flow, and coastal storms such as Tropical Storm Debby in August 2024, which resulted in catastrophic flooding of coastal municipal areas in the region (Fig. 4).
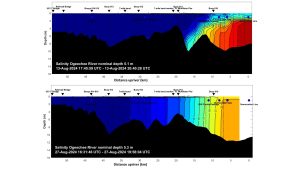
BOTTOM: Two weeks later, after flood waters receded completely, tidal salinity remained well downriver, with initial salinity reaching into but not through the seven mile bend
Groups of these low-cost drifters with GPS units attached are being deployed in the field into each of the Georgia river systems on the southeast coast. A set of drifters will be monitored until contact is lost to determine water flow patterns from each river system. This information will be key in determining the extent of the influence of Georgia coastal waters, a likely carrier of small particulate plastics, on GRNMS.
Primary and secondary analysis of particles
Stereomicroscopes are being used as a primary analysis method to quantify the abundance of microplastics in water, sediment, and organismal samples. for preliminary identification isolation, cataloguing, and characterisation of particulates prior to instrumental analysis.⁶
Polymer type cannot be definitively identified by stereomicroscope, although particles could be nominally identified as plastic as opposed to a naturally occurring substance by use of the stereomicroscope. Particles that are suspected to be plastic (“probable plastic”) are isolated onto a tagged location affixed to an aluminium disc. While a standardised method for reporting microplastic values has not yet been developed, this team is working with other scientists who are studying small particulate plastics toward the goal of developing standardised procedures.
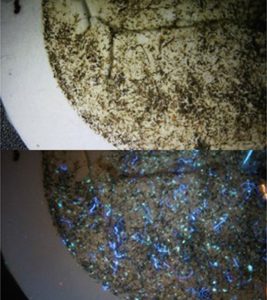
Graduate student James Bird has been developing and testing a fluorescence procedure using blue- and UV-light sources that are responsive to optical brightening agents and other additives that are particularly found in textiles. This approach reduces analysis time and improves accuracy and precision in users visualising and isolating probable plastics during this first analytical stage. The procedure involves a series of steps in which the user evaluates attributes of the particles being viewed, including appearance under blue-, white-, and UV-lights (Fig. 2), as well as brittleness, surface appearance, and other texture-based attributes. Considering that secondary analysis of samples isolated by novice users with the stereomicroscope resulted in 60-70% particle affirmation on Raman spectroscopy as plastic, this lab group expects improved confirmation rates as users become more proficient with the fluorescence-added primary analysis technique.
Raman microscopy secondary analysis
In partnership with Jay Brandes of the University of Georgia Skidaway Institute of Oceanography, micro-Raman spectroscopy is being used as the consistent secondary analysis method for probable plastic particles from samples to identify plastic polymer type with a modified procedure.14 A 785 nm-laser on a confocal Raman microscope is used to identify presumed plastic particles.15 Raman spectra are typically recorded in the 400-2,300 cm–¹ wave number range. The gradient is set at 600 lines/mm. A high-sensitivity cooled electron-multiplying charge-coupled device (EMCCD) detector is used. The Raman system is operated by LabSpec6 software (Horiba®). The KnowItAll® software is used to compare Raman-generated spectra to known spectra within the KnowItAll® library.
Pyrolysis Gas chromatography-mass spectroscopy (pyr-GC/MS) secondary analysis
In partnership with Ashok Deshpande of NOAA’s Northeast Fisheries Science Center Chemistry Laboratory, Pyrolysis GC/MS will also be used for comparative secondary analysis.16 A microplastic particle <1 mg is placed in a quartz tube, which is then placed in a platinum coil and heated to 750 °C.16 The heating process vaporises the microplastic particle into small chemical fragments or monomers that are unique to a given polymer type.16 These fragments are separated on a gas chromatographic column and identified by using a mass spectrometer, which can also identify plastic additives.16
References
- Cohen and Gleason 2015
- Lee and Sanders 2015
- Keisling et al. 2019
- Sanders and Brandes 2020
- Geiger 2021
- Setälä et al. 2016
- Sagawa et al. 2018
- Claessens et al. 2011
- Thublin 2018
- Ransome 2022
- Blanton et al. 2004
- Benke et al. 2000
- Garvine 1985
- Araujo et al. 2018
- Hidalgo-Ruz et al. 2012
- Ravit et al. 2017
Please note, this article will also appear in the 20th edition of our quarterly publication.

