Daniel Rodriguez and Oleg Korenok from the School of Business and Ruben Glover and Supathorn Phongikaroon from the Department of Mechanical Engineering, at Virginia Commonwealth University, examine the benefits of small modular reactors compared with solar energy options.
Money talks, especially when it comes to powering our future. Right now, we’re at a crossroads between two fascinating clean energy options: small modular reactors (SMRs) and renewable energy. Both are clean, and everyone knows nuclear is expensive and renewables are cheap, but is that the real story?
When utilities and governments are deciding between these technologies, they’re not just looking at fancy brochures. Understanding an asset’s value and risks is critical for meeting future demand cheaply and reliably. For the public, one measure that is often used to understand costs is the Levelized Cost of Electricity (LCOE). LCOE is basically the ‘break-even’ price for electricity – like figuring out how much you need to charge for lemonade to cover everything from the lemons to the paper cups, but way more complicated. It factors in everything: construction costs, interest rates, tax breaks, and even environmental impact. Imagine adding up all your lemonade expenses for the coming decades, dividing it by how much lemonade you’ll produce over the years, and voilà – you’ve got your LCOE. The basic formula is as follows:¹
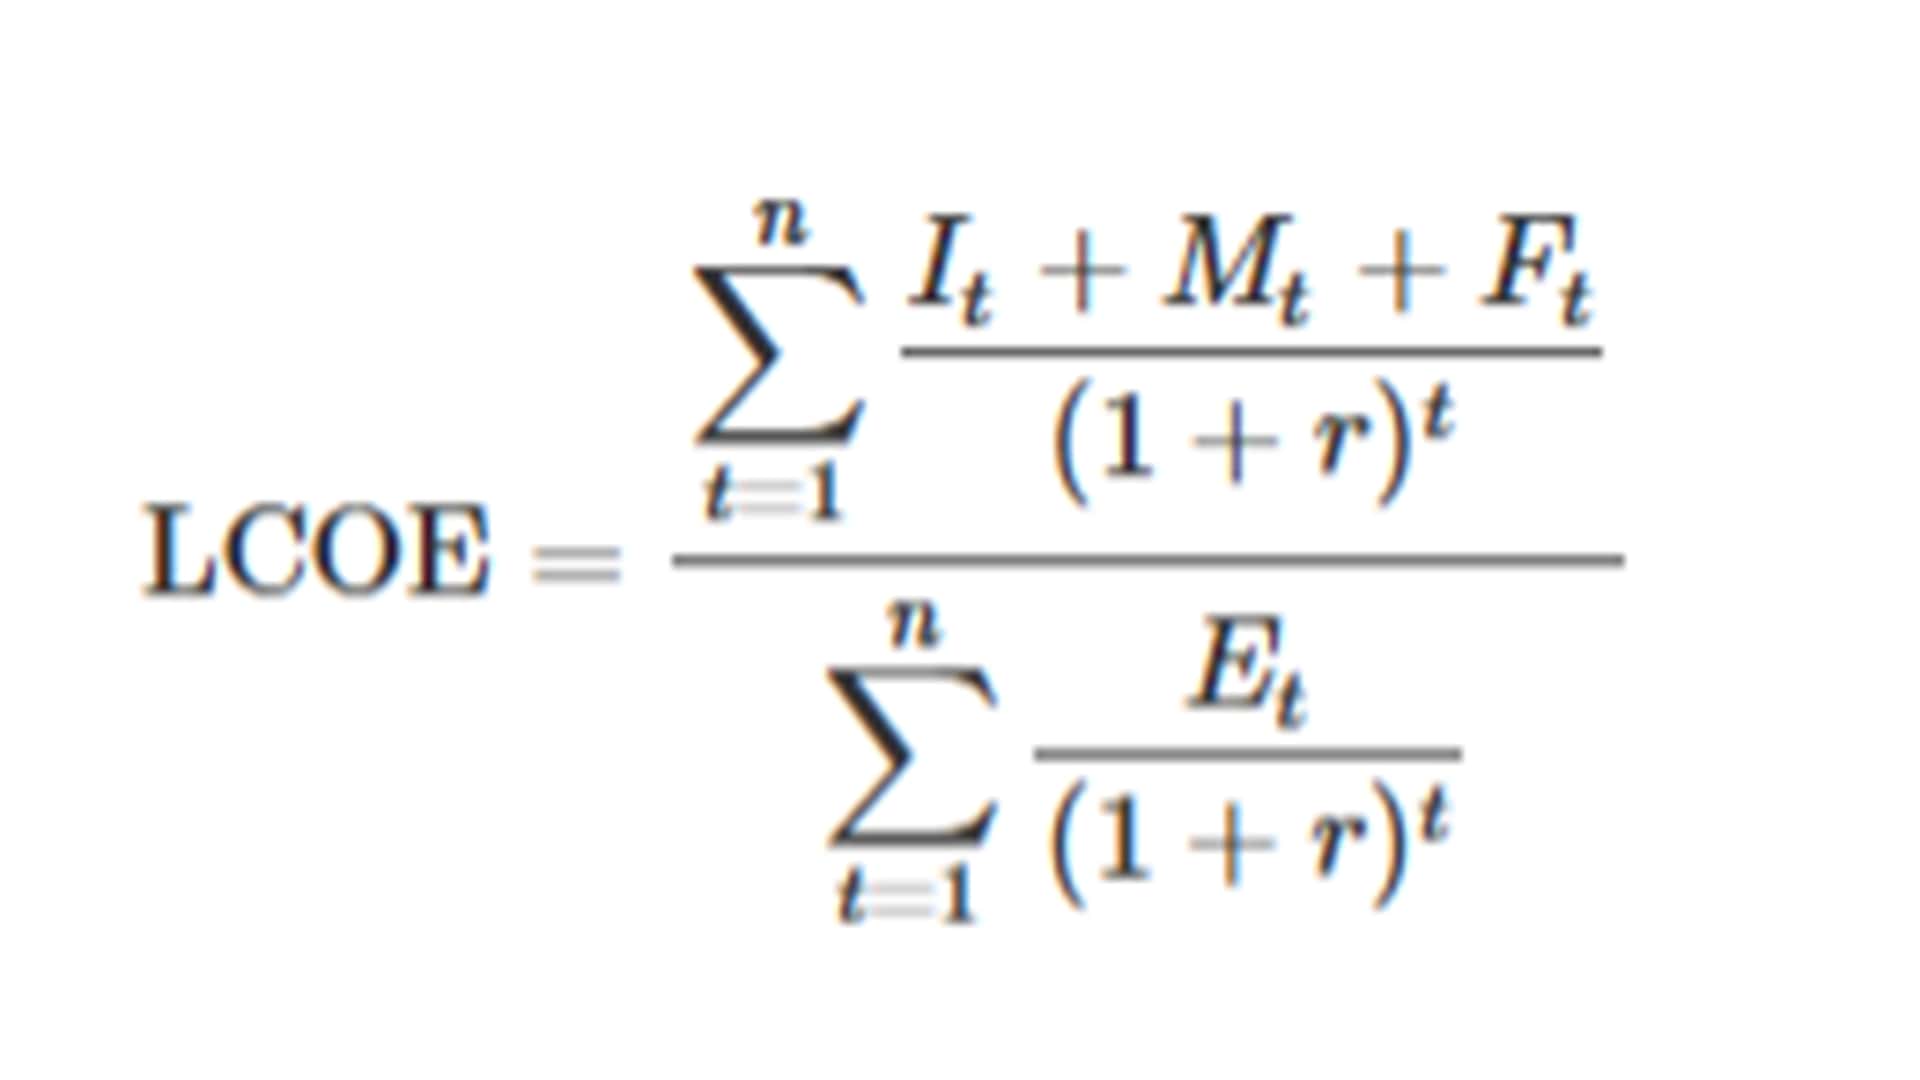
Where It are investment expenditures related to capital costs at year t (construction costs, equipment costs, installation of asset, etc. and also where tax credits are inputted), Mt are operation and maintenance expenditures at year t (excluding fuel costs), Ft are costs associated with fuel consumption at year t – applicable to fuel-dependent energy sources – and Et is the amount of electricity produced by the asset at year t. The variable, r, is the discount rate – the interest rate used to discount future cash flows to their present value, reflecting the time value of money and investment risk. The discount rate has a large impact on the NPV calculations and is affected by the types of funding available to the project, risk comparisons, interest rates, etc.²
The LCOE metric distills the many assumptions and projections of long-lived assets into a single number, making it easy to use to compare different technologies. While this ‘cost per unit of electricity’ measure simplifies analysis, it does come with many drawbacks.
For instance, a renewable energy source does not work 100% of the time. This fact is captured in the total electricity produced as the denominator for LCOE, but what is not captured is when the electricity is produced. A utility needs to deliver electricity when it’s needed, and oftentimes it is needed most when the sun is not shining.
Another important consideration that is entirely missing from the LCOE is any revenue analysis. The price of electricity on a regional grid is not static hour to hour. As seen during the recent cold weather in the US, prices more than doubled in some regions during peak hours.³ If a generation source cannot supply during times of higher prices, its project value should decrease.
Value to the grid is another nuanced topic that is important to quantify, but LCOE ignores it completely. Take flexibility, for instance – some power plants can switch on and off quickly when needed, while others take forever to start up or cannot start up at will. LCOE doesn’t care about that difference.
Here’s another big miss: storage costs. When the sun isn’t shining or the wind isn’t blowing, you need somewhere to keep all that extra solar and wind power you generated earlier. Those storage costs add up, but the LCOE value for renewables rarely includes storage costs. Sometimes this leads to weird situations where power companies actually have to pay people to use electricity during off-peak hours – try explaining that one to your boss.4,5
VCU’s project goals
As we’ve noted, electricity prices bounce around all day every day, like prices in the stock market. Just because it costs you $50 to make a megawatt-hour doesn’t mean you’ll always sell it for more than that. Similarly, according to the regional transmission organisation PJM, peak demand is expected to increase 2.4% per year for the next ten years.⁶ This growth may lead to higher peak prices, but LCOE does not provide any information at all about the potential revenue impact of variable prices or the time of day.
This project aims to bridge that gap. We want to compare what it costs to make power (LCOE) with what we can sell it for at the time of production.
Here are the ground rules we’re working with:
First, we’re comparing two types of power plants: small modular reactors and solar plants. To keep things simple, we’re assuming the grid is either one source or the other. The big difference? Solar only works during daylight hours (obviously), while SMRs can run 24/7.
Second, we assume there’s a simple buying and selling system. If our plant makes more power than people need, we can sell the surplus and make more money. If we’re not making enough to meet demand, the difference must be purchased at the market price. If we have to import demand at peak times, we don’t account for demand shifting or storage.
Here’s a real-world example to make this crystal clear: Let’s say you run a solar plant. It costs you $35 to make one megawatt-hour (that’s your LCOE), and the market is buying electricity for $46 per megawatt-hour. Your plant makes 300 megawatts, so:
• Cost to produce: 300 MW × $35 = $10,500
• Revenue from selling: 300 MW × $46 = $13,800
• Profit so far: $3,300
However, if demand is 320 megawatts, you’re short by 20 MW. You’ll need to buy that extra power at the market price:
• Extra cost: 20 MW × $46 = $920
• Final profit: $3,300 – $920 = $2,380
The general equation is shown as:
Profit=(Net Gen • Price) – (Net Gen • LCOE)-((Demand – Net Gen) • Pbuy
Where G is generation capacity of the plant (in this case it is a fixed 300 MW), D is demand of the market on a specific hour, Market Price is the price the market pays for the electricity, LCOE is the LCOE of the energy production centre, and Pbuy is similar to Market Price in the idea that it is the price the plant must pay to buy electricity to meet demand. If generation is greater than demand, we have ‘excess’ profit.
Solar plants are unique in that they do not produce electricity for about twelve hours of the day – therefore, for the current scenario, they must buy all the electricity they cannot produce, whereas nuclear can continue to produce throughout the day. For solar downtime, we would only take into consideration demand and Pbuy to calculate the profit.
This more complete picture helps us understand not just what it costs to make power, but how much money these plants can actually make in the real world. It’s the difference between knowing the cost of running a business and knowing if that business will actually turn a profit.
How the project is being done
At its core, this project aims to answer a straightforward question: how do SMRs compare to renewable options when revenue and demand are considered? To better understand this question, we need to know how much electricity costs per hour and when these generation sources can deliver electricity.
We’re working with three main sets of data, all focused on the Dominion Energy footprint in the PJM region:
- Hourly pricing data from PJM Interconnections Data Miner 2, showing us exactly what electricity sells for in different locations.
- Hour-by-hour electricity demand data from Dominion Energy.
- Generation data showing how much electricity is actually being produced from the Energy Information Administration.
Let’s break down what we found.
First, we tackled the pricing data. Every hour, hundreds of locations in Dominion’s service area receive updated prices settled at auction in PJM’s Real-Time Spot Market. This gives us about 14 million individual price points for 2024 – a massive amount of data. To make this manageable, we used R to combine all these prices into a single, representative price for each hour of the year.
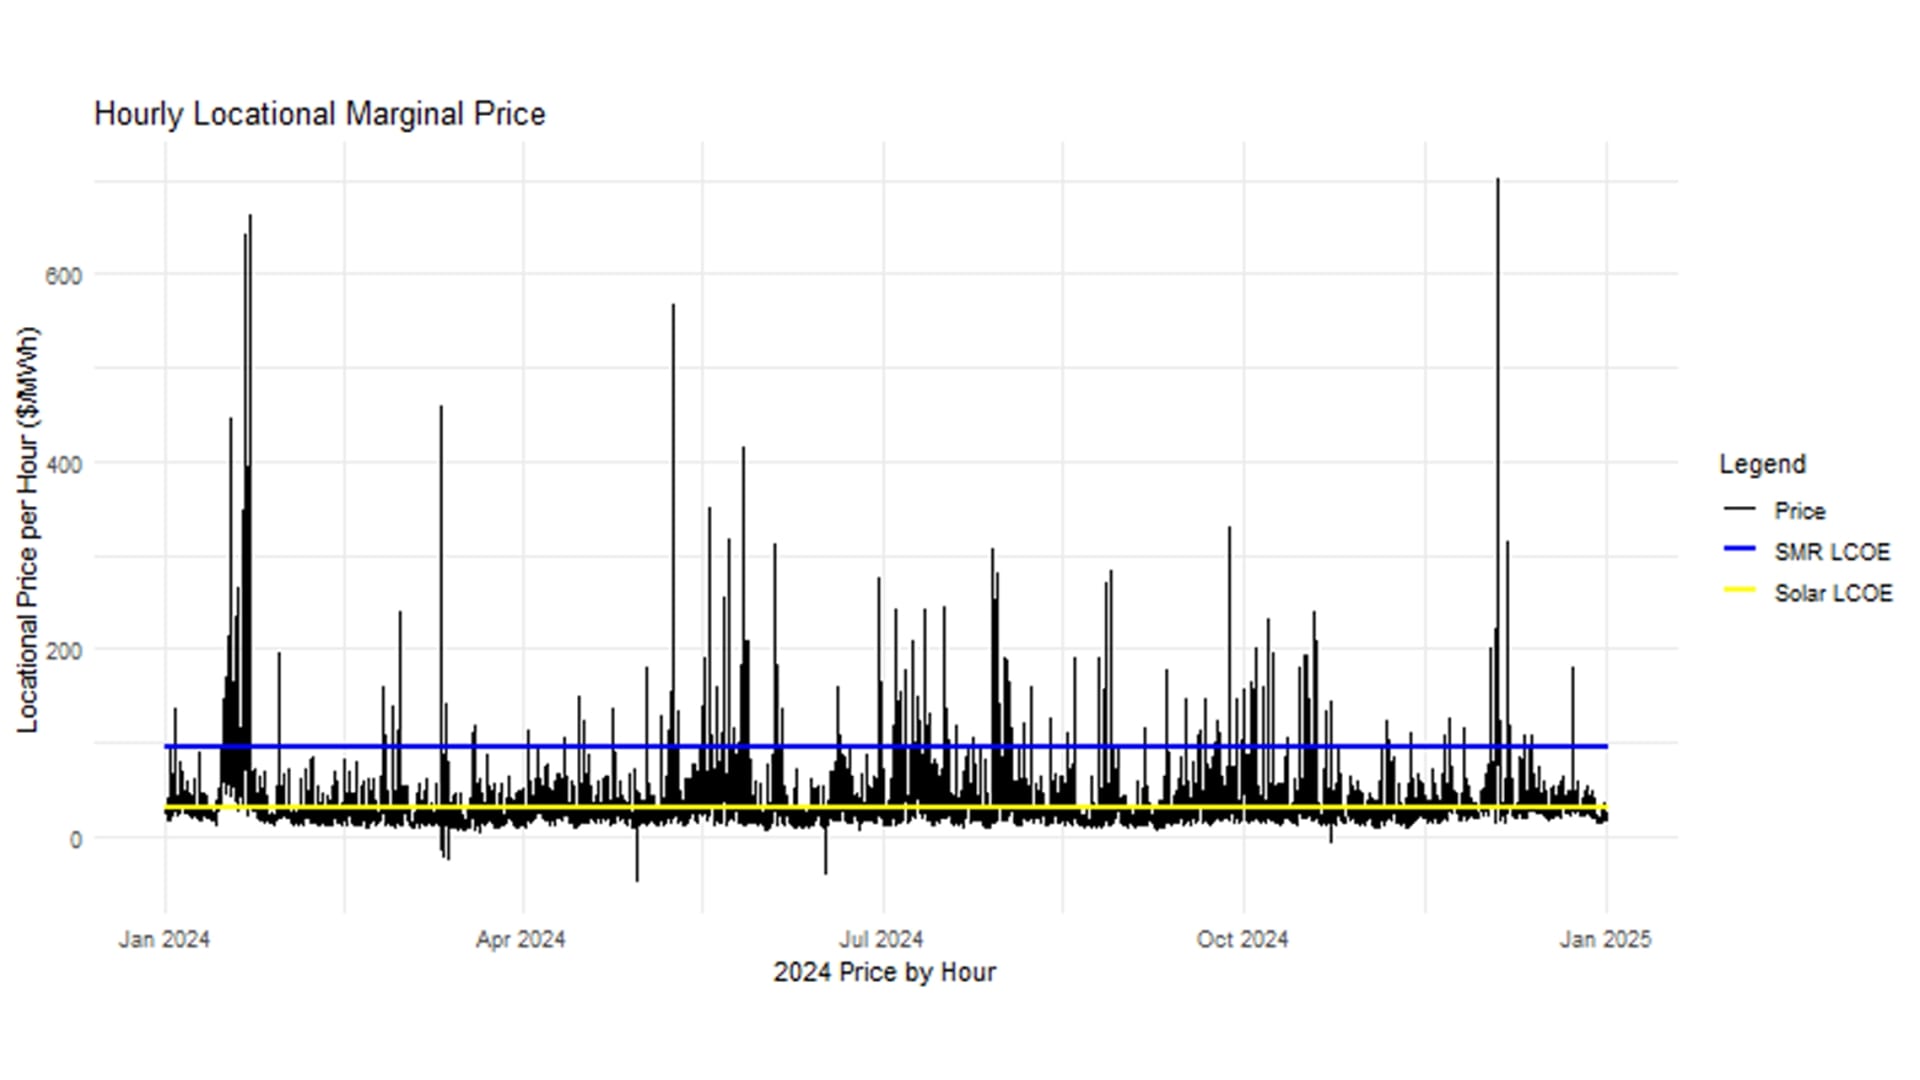
Fig. 1 tells an interesting story. It compares actual market prices with the minimum prices needed for SMRs and solar plants to be profitable. We are using National Renewable Energy Laboratory’s Annual Tech Baseline for the LCOE estimates. For SMRs, the estimated LCOE by 2030 is $94 per megawatt-hour. For solar, in 2030 the LCOE is estimated to be $30 per megawatt-hour.7
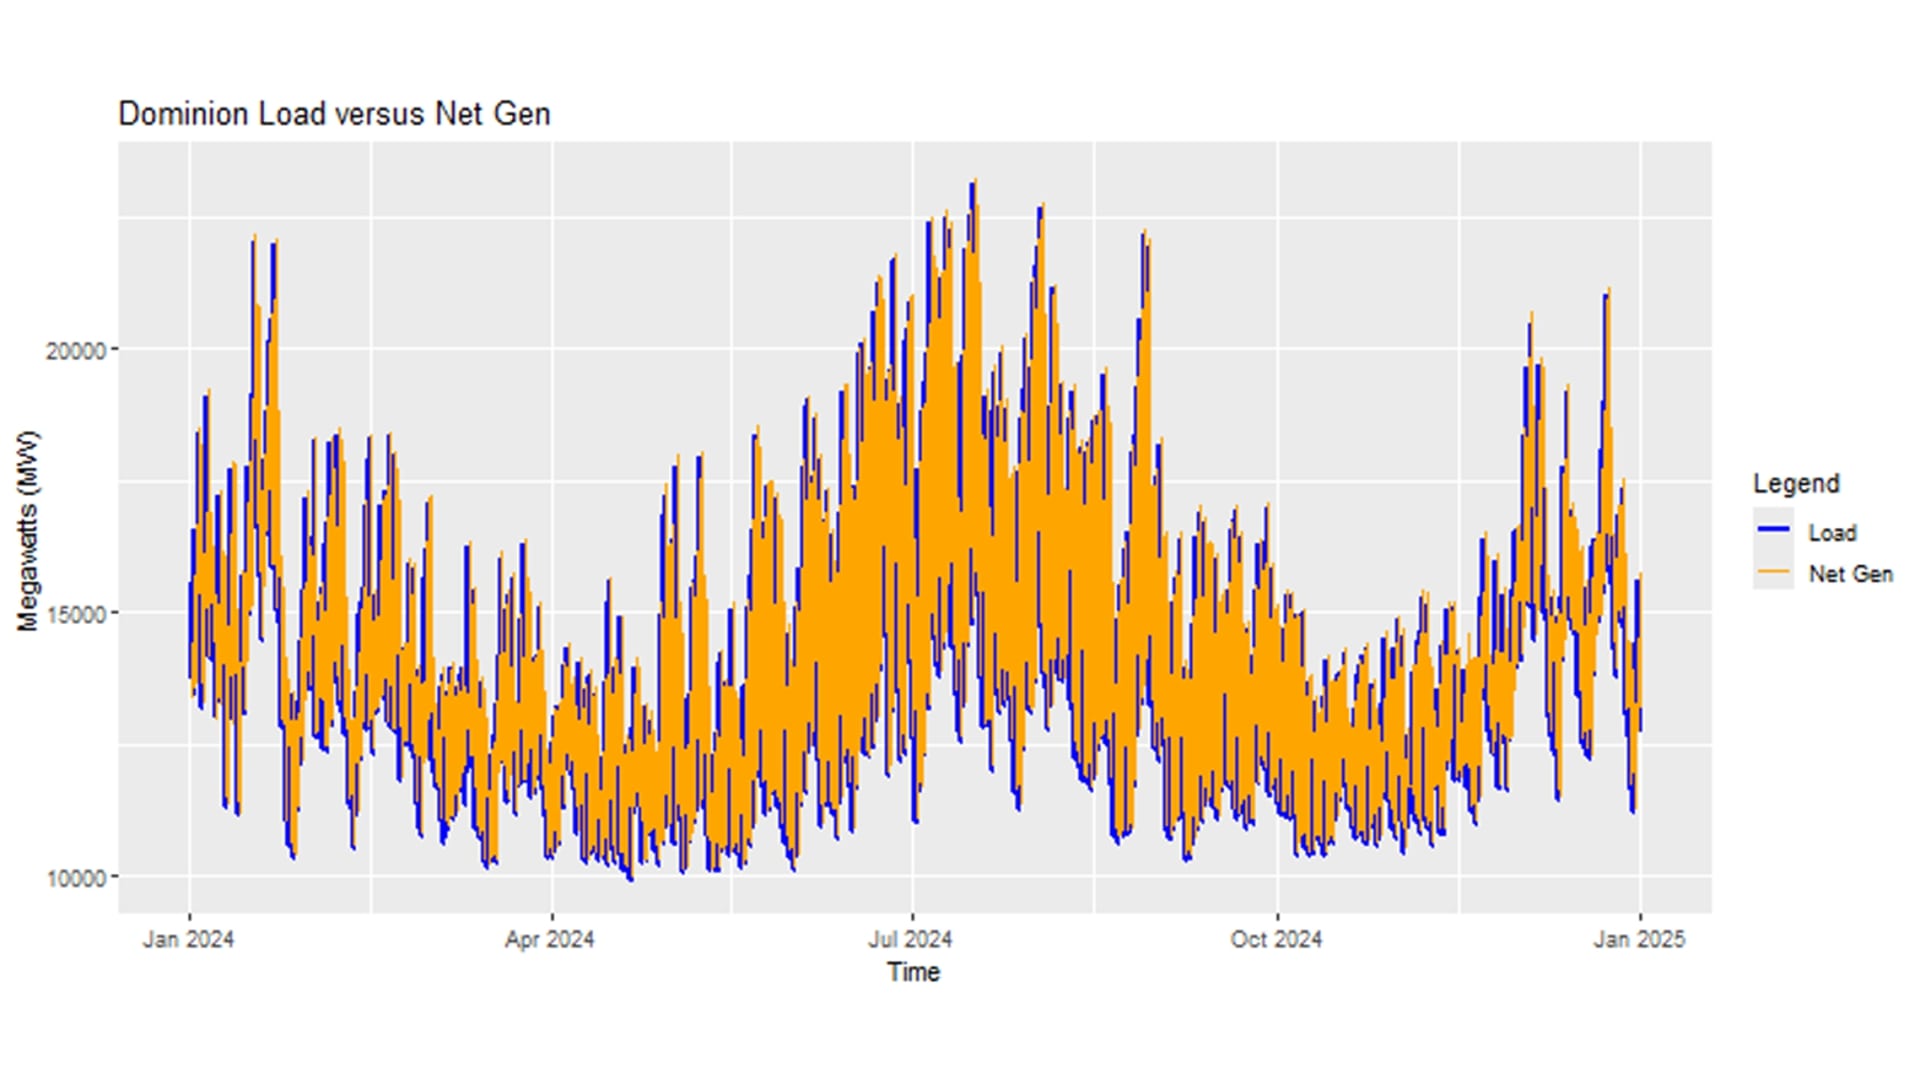
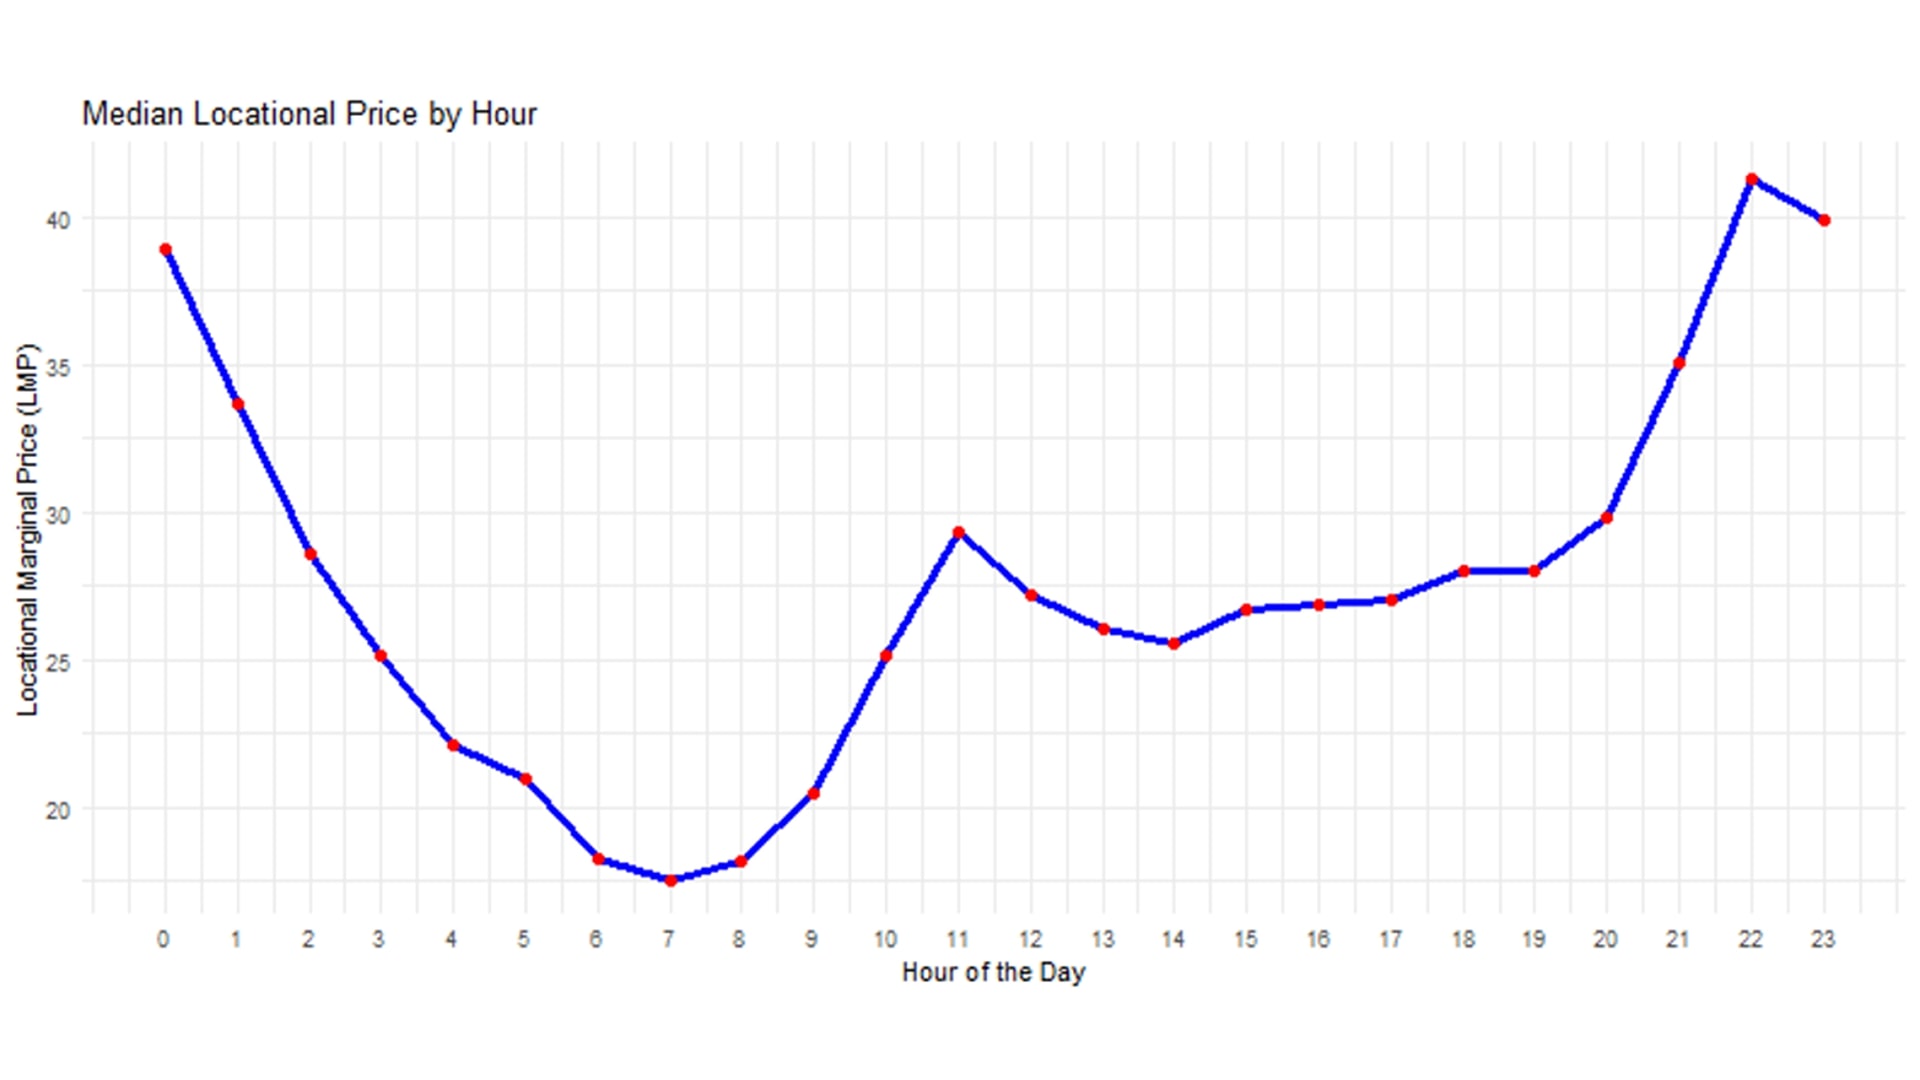
Fig. 2 gives us a picture of supply and demand, or ‘generation’ versus ‘load’. The graph gives us a sense of when Dominion produces more electricity than needed, and when it falls short. Fig. 3 provides the median ‘localised marginal price’ in the PJM market by hour. This data can give a baseline revenue profile for generation assets, aligning their generation profiles with the price of electricity at any given hour. Median prices do not show peak prices, which are points of time where grid reliability is at a premium.
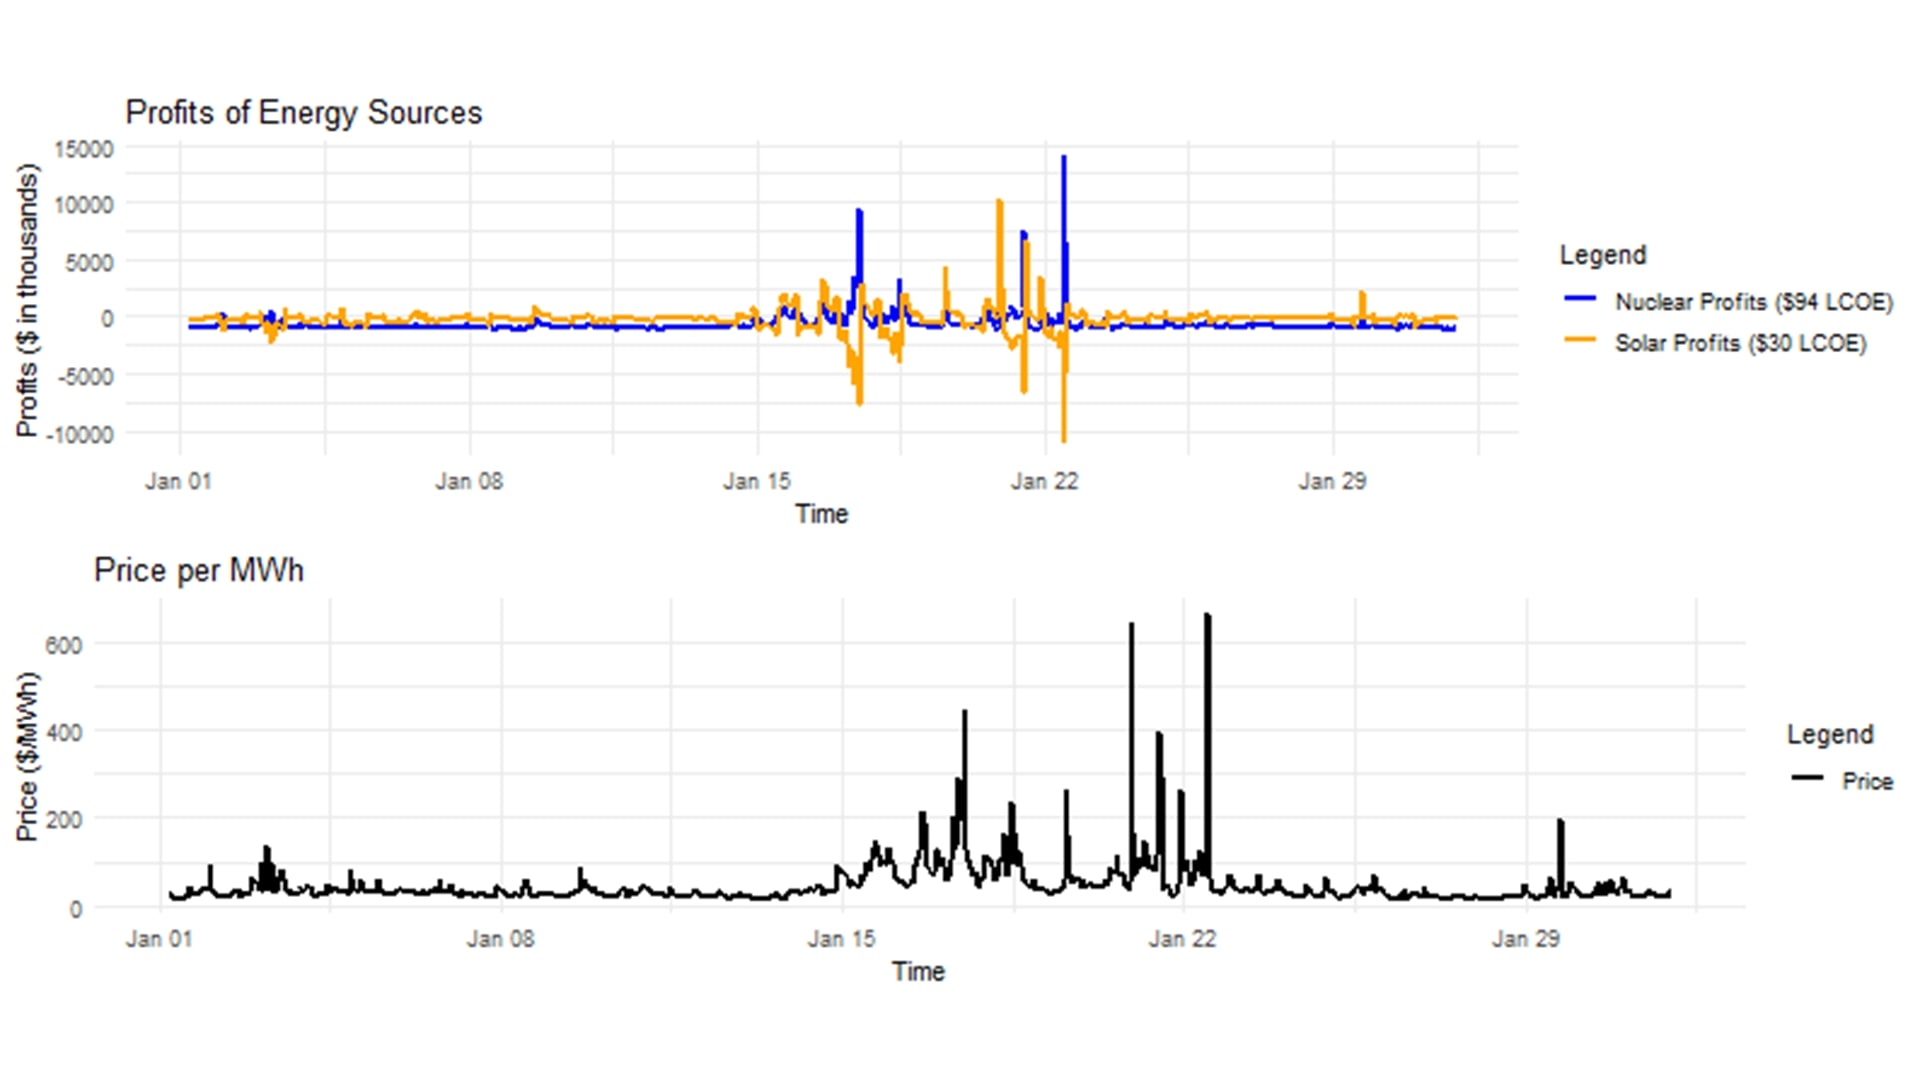
Fig. 4 gives us a glance at peak prices and the difference with LCOE values for our energy sources. In this graph, we compare revenues and costs with prices during the month of January. We take into account solar downtime, which causes us to have to buy electricity to meet the load at the specified price during that time – leading to some interesting situations where large fluctuations in price causes solar to be extremely unprofitable.
This analysis sets the stage for deeper investigation into how these factors will affect the final revenue projections.
Next steps
Here’s what we need to do next:
First, we’ll take our current data and scale it down to a more manageable size. Normalising the data will allow us to give an apples to apples comparison. This will help us figure out how building either a small modular reactor or a solar plant could affect revenues.
Then, we’ll compare the value potential of both options. We’ll do this by looking at the LCOE and calculating the Net Present Value of their respective value propositions with respect to prices and generation availability.
Finally, we’ll try to understand how increasing our baseline power generation capacity might affect electricity prices.
By normalising the data, comparing costs through LCOE and NPV analysis, and assessing the impact of increased baseline generation on electricity prices, we aim to identify the most economically viable option between a small modular reactor and a solar plant. This comprehensive approach will help guide strategic decision-making for every stakeholder.
References
- Levelised cost of energy – A theoretical justification and critical assessment – ScienceDirect
- Shortcomings of the traditional “levelized cost of energy” [LCOE] for the determination of grid parity – ScienceDirect
- Brutal cold snap boosts US power, natural gas demand, prices — S&P Global
- Comparing the Costs of Intermittent and Dispatchable Electricity Generating Technologies – American Economic Association
- “A Review of Solar Photovoltaic Levelized Cost of Electricity” by K. Branker, M. Pathak et al.
- PJM Long-Term Load Forecast — PJM Inside Lines
- https://atb.nrel.gov/electricity/2024/index
Please note, this article will also appear in the 21st edition of our quarterly publication.