Big data analysis and visualisation play a key role in understanding complex mobility systems and planning urban mobility.
Creating a more liveable environment is a priority for many cities worldwide. In terms of urban mobility, this presents numerous challenges.
On the one hand, cities must guarantee that people can get from A to B in a comfortable, safe, and affordable way. On the other, they need to consider the economic and environmental aspects that urban mobility can have. Furthermore, new mobility offerings and services are constantly affecting the transportation landscape.
So, to shape future mobility, cities need to understand their entire, complex mobility ecosystems. This is where big data analysis and visualisation play a key role.
Even politicians have recognised that big data is crucial to transportation planning. German Chancellor Angela Merkel recently announced a plan to set up a ‘Mobility Data Room’ for Europe. This will collect real-time data from various sources: the automotive industry, public transport, and new mobility providers.
Christian U. Haas, CEO of the German software company PTV Group, said: “Cities not only need to be forward-thinking and innovative but become the driver when it comes to mobility. The smart use of data offers many possibilities in understanding, managing, and regulating mobility.”
Evaluating infrastructure
Data-driven analysis helps evaluate existing infrastructure as well as to examine ‘what-if’ scenarios: What is the travel demand during different times of the day? What is the capacity of a public transport system? Are there bottlenecks? Will new mobility modes improve services in an existing transport network?
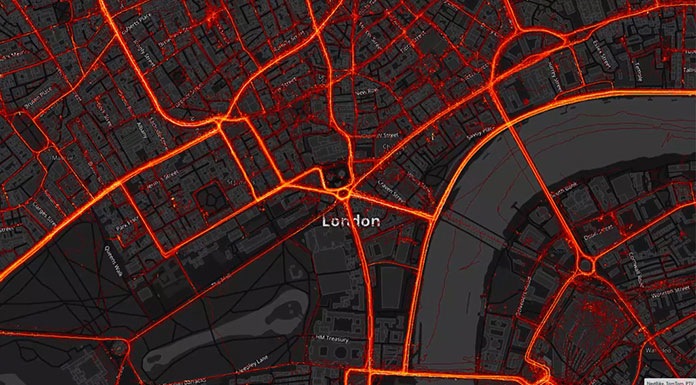
Whether specific roads, neighbourhoods, or even entire regions are being investigated, so-called ‘heat maps’ can illustrate the traffic volume across the entire route network and highlight hot spots. Such visualisations enable traffic planners to identify where the potential for optimising the infrastructure is.
Implementing regulatory measures
With the help of big data analysis and visualisation, policymakers can also immediately test and evaluate the implementation of regulatory measures: will a new congestion charge reduce traffic in the city centre? How can bans on passing or parking be implemented? Where should an emission-free zone be best established?
“Visualisations on a digital map support the decision-making process – for example by enabling transparent and comprehensive communication between stakeholders and the public,” Haas explained.
This makes it easier to collect feedback, discuss alternatives, and provides a solid basis for implementation of traffic measures.
Planning new mobility offers
Another field in which big data analysis can help is the planning and operation of new mobility services. With an ever-growing number of new mobility solutions enriching the range of transportation services, it is up to the cities to take the lead. Only with the appropriate framework will new services come to effectively complement existing mobility offerings and benefit both citizens and the environment.
Data analytics enables cities to evaluate the effects, chances, and risks in advance: is another e-scooter provider needed? What are the best locations for docking-stations? Which operating area would be suitable for a new bike sharing service? In which areas should car-pool services, such as Uber, be allowed to operate?
If cities address these questions and challenges, they can provide the framework for attractive and successful mobility measures.
Data is also an important source of information for fleet operators planning to offer new mobility services. It allows them to evaluate the best conditions to make their business model work. For example: What is the expected demand for the service? How many passengers and vehicles would be needed to meet this demand in the most economical way?
Haas said: “Data analytics and visualisation offer transparency and enable city and traffic planners to make strategic and operative decisions based on verifiable facts. These tools are the key to shaping sustainable mobility and thus liveable environment for citizens. Providing data analytics and visualisation, as well as transportation models, is one of our core competencies at PTV Group. We are looking forward to supporting cities leading this process.”
Using data to keep the traffic flowing
It is a common sight on streets worldwide: one car after another stuck in traffic. In many big cities, it is getting harder to drive smoothly from point A to point B.
In this year’s TomTom Traffic Index, Bengaluru takes the top spot. Due to congestion, drivers are spending an average of 71% extra travel time on the roads in the southern Indian city. Next in the global ranking are the Philippine capital, Manila (71%), and Bogota in Colombia (68%). But how can cities beat traffic congestion?
Traffic congestion has increased globally during the last decade, and the 239 cities that TomTom included in its report had increased congestion levels between 2018 and 2019, with only 63 cities showing measurable decreases. There are many reasons for the worsening of traffic flow, such as more cars on the roads; the poor synchronisation of traffic lights; and unforeseen events such as accidents or severe weather conditions.
However, one of the biggest factors affecting traffic is predictable: construction sites.
Hamburg construction site management
To take the city of Hamburg, Germany’s second largest city, as an example: in 2019 alone, there were around 25,000 planned construction projects in the city. 3,700 of these affected the road network, bringing great misery to commuters. To tackle its growing traffic problems, including those caused by construction, Hamburg recently started using a software for forecasting congestion.
Dr Melanie Mergler, who leads the project on behalf of the Hamburg State Agency for Roads, Bridges and Waters (LSBG), explained its goals: “One of our main tasks was to develop simulation software that enables improved congestion forecasting and the collection of real-time traffic data. Employees of LSBG and traffic policemen will be provided with a tool to analyse the interactions between congestion and construction measures and thus improve the entire traffic flow.”
A new software solution
The LSBG relied on the expertise of two software providers: WPS – Workplace Solutions and PTV Group. Together they developed a software solution for congestion forecasting, which consists of
two components:
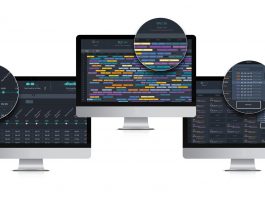
- An intuitive frontend system of ROADS – a software for the co-ordination of construction measures and analysis of changes in traffic flow; and
- An intelligent backend system powered by PTV Visum – a traffic demand model for simulating and calculating the impact of disruptions in traffic.
Explaining the special features of this software solution, Wolfgang Pelousek from PTV Group said: “Existing software solutions for planning of road works typically provide no information on resulting relocation of traffic flows. Our new tool offers this information. Users can now plan their construction sites smartly.”
In April 2020, the system was integrated into the operations of LSBG and the traffic control centre. Hamburg is now using the software for congestion forecasting for its long-term and short-term traffic planning.
Long-term traffic planning
In long-term traffic planning, planners use the simulations to analyse the effects of future construction work that requires changes in routing, such as lane narrowing, lane closures, or detours. They look at possible scenarios and their impact on the traffic situation, even after construction ends. The result is an improved, and permanent, traffic flow.
In the district Harburg in Hamburg, for example, major construction projects are planned for 2021, requiring full or partial road closures. Authorities used the simulation software to plan where to shift traffic from those roads. When the simulations showed that the alternative roads will be completely clogged, planners decided to begin the projects at different times.
Short-term traffic planning
In short-term traffic planning, authorities can use the software to simulate how incidents or ad-hoc events affect the road network. This allows the police to act to stabilise the traffic situation – for example by suggesting alternative routes and sharing them with news outlets.
In June 2020, activists of the environmental movement ‘Extinction Rebellion’ blocked all access roads to Hamburg’s Köhlbrand Bridge. Police at the traffic control centre simulated this unforeseen street closure and its effects on the surrounding road network. They were then able to take a number of corrective actions.
Outlook: ITS World Congress 2021
In autumn 2021, Hamburg will host the world’s largest and most important event for intelligent and digital mobility, the ITS World Congress. The Hamburg congestion forecast programme will be one of the highlights of this event and will be presented by LSBG’s DigiLab.
Empowering mobility
The PTV Group provides software solutions and consulting services to empower mobility and transport for a cleaner and smarter future. Customers in over 120 countries rely on PTV solutions – its best-in-class software for intelligent traffic management and transport optimisation enables decision-makers in politics, cities, organisations, industries, and logistics to save time and money, make roads safer, and protect the environment.
900 employees worldwide work on powerful, future-oriented solutions to create intelligent and eco-friendly mobility for everyone.
Kristina Stifter
Head of Global Communications
PTV Group
+49 721 9651 0
info@ptvgroup.com
Tweet @PTVGroup
www.ptvgroup.com/en
Please note, this article will also appear in the fourth edition of our new quarterly publication.


